|
HOME
New Article:
THE MIDWEST: Hole in the Donut
New Article:
EMPIRE TRAP
New Article:
MILITARY BUILDUP (PDF File)
New Article:
IMMIGRATION
New Article:
JESUS AND EMPIRE
Core Concepts:
NONPRODUCTIVE GOVERNMENT
Core Concepts:
EVERY OTHER
GENERATION
Graph:
CRIME
AND MILITARY SPENDING
Graph:
REAGANOMICS
Graph:
LONG
TERM TREND
Graph:
FEDERAL SPENDING
ABOUT THE AUTHOR
ORDER
BOOKS AND TAPES
| |
|
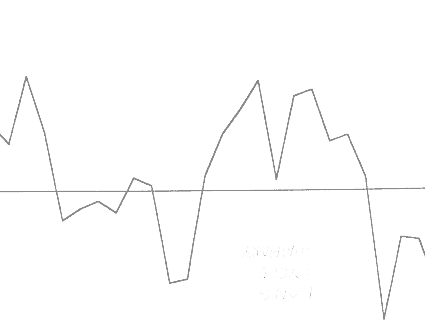
This is a graph of five-year averaged periods of the difference in temperature
between the
Northern Hemisphere and Southern Hemisphere, one of three driving forces
in the long cycle.
Ice Cores going back several hundreds of years indicate a strong 55 year
cycle in global warming.
The big bulge right of center is the period
1921-1968 when the North was dominant around the 1940 global warming
peak in the middle of the century.
See the book Real Economy for details. |
|
|

|
|
