|
HOME
New Article:
THE MIDWEST: Hole in the Donut
New Article:
EMPIRE TRAP
New Article:
MILITARY BUILDUP (PDF File)
New Article:
IMMIGRATION
New Article:
JESUS AND EMPIRE
Core Concepts:
NONPRODUCTIVE GOVERNMENT
Core Concepts:
EVERY OTHER
GENERATION
Graph:
CRIME
AND MILITARY SPENDING
Graph:
REAGANOMICS
Graph:
LONG
TERM TREND
Graph:
FEDERAL SPENDING
ABOUT THE AUTHOR
ORDER
BOOKS AND TAPES
| |
|
|
|
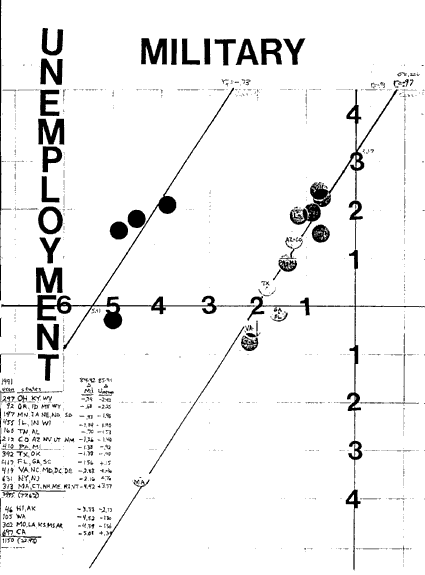
This graph of the military reduction period from 1984-1992 shows how the
low military states did tremendously better and the high military states
all had the worst unemployment rate changes. Military spending went
from 6.4% of GDP to 4.4% of GDP in this period. The Eastern 78 % of the
American economy has a strong 97% relationship between the military cuts
and unemployment changes, as shown on the tradoff line on the right. The
y axis is flipped around and labelled employment to show that low
military cuts giving rise to the biggest drops in unemployment rate
(employment increases). The left most line shows the tradeoff in the
far West is not consistent with the East, but is still consistent with
the military changes.
|
|